To Immigrate to Northern Ontario, or not to Immigrate
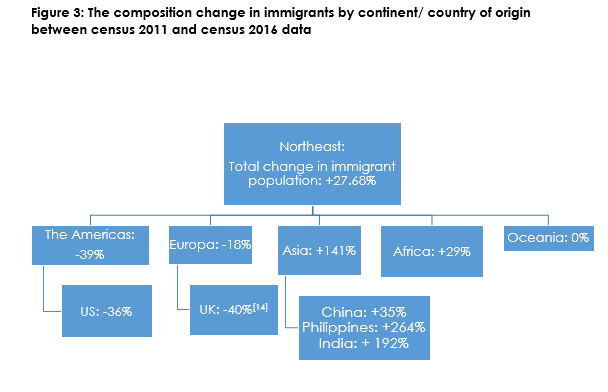
August 13, 2019 - Immigrants are essential for increasing cultural diversity and addressing labor shortages in Northern Ontario. According to Statistics Canada’s 2011 and 2016 Censuses, the percentage of the Northeast immigrant population had increased 27.68 per cent between 2011 and 2016 while the Northwest saw a 13.99 per cent decline in immigrants in the same period.[i] So, what is happening with the Northwest? To solve this puzzle, let’s zoom into the data and look at the change in number of immigrants in terms of continents and countries of origin.
Continent of Origin
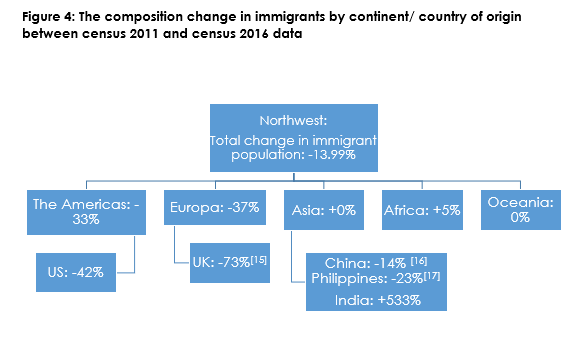
Comparing the 2011 and 2016 Censuses, the number of immigrants coming from the Americas and going to the Northeast significantly dropped by 39 per cent; 18 per cent for Europe (Figure 1). A similar situation happened in the Northwest with 33 per cent less immigrants from the Americas and 37 per cent less European immigrants (Figure 2).
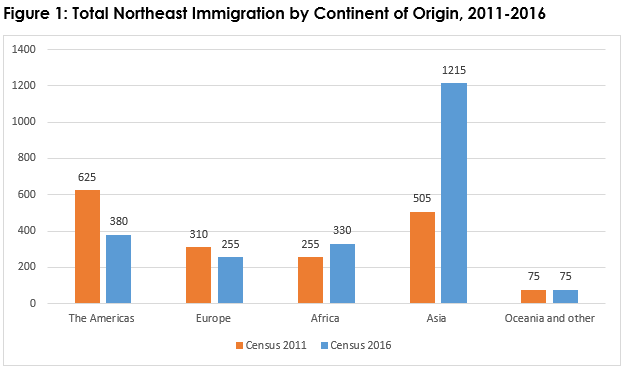
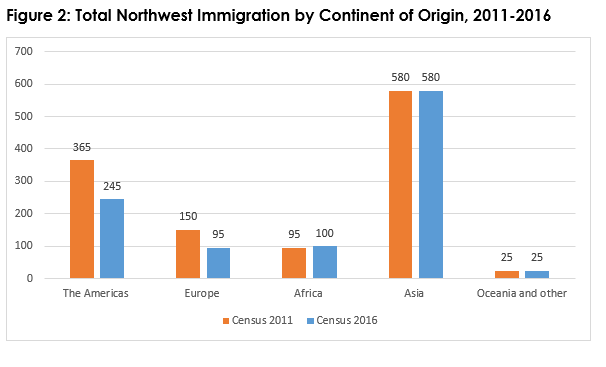
While the number of immigrants coming from Oceania stayed stable between 2011 and 2016 in both Northern Ontario regions, the Northeast has done an excellent job at attracting immigrants from Africa and Asia, with a 29 per cent and a 141 per cent increase, respectively. It is no surprise to see a big ‘jump’ of Asian immigrants in the Northeast because according to the immigration and ethnocultural diversity research from Statistics Canada, Asia (including the Middle East) was the primary source continent of recent immigrants to Canada in 2016, accounting for 61.8 per cent of all newcomers. Furthermore, according to Statistics Canada’s census of population, Canada is expected to have between 55.7 to 57.9 per cent of foreign-born immigrants to be from Asia by 2036. It is also projected for Canada to have 15.4 per cent of immigrants to be from Africa by 2036.
Now let’s see how the data on the composition of immigrants described above explains the puzzle. The Northeast appears to have a more favorable immigration condition because the increase in Asian and African immigrants exceeded the sum of the immigrants lost from Europe and the Americas. As for the Northwest, the increase in immigrants from Africa and lack of increase from other continents could not balance out the loss of immigrants from Europe and the Americas.
Country of Origin
After understanding the ‘big picture’, it is time to take a closer look at the top country where immigrants originate from in each continent.
In the Americas, the United States (US) has been the top country of origin from this continent for both Northern Ontario regions in the past two census periods. However, there was a 36 per cent decline in immigrants from the US to the Northeast with only 230 immigrants between 2011 and 2016 compared to 360 immigrants between 2006 and 2011. Similar conditions applied to the Northwest because the number of US immigrants had decreased from 295 between 2006 and 2011 to 170 between 2011 and 2016, which represents a 42 per cent loss.
For Europe, the United Kingdom (UK) is the most common country of origin from this continent for both Northwest and Northeast immigrants. In 2016, there were 20 immigrants from the UK coming to the Northwest whereas this number was 75 in 2011. Likewise, the number of immigrants was 150 in 2011 and dropped to 90 in 2016 for the Northeast.
What about the countries from Asia? Three countries were selected: China, India and Philippines as they were the top three countries of origin from this continent for recent immigrants according to census of population 2016. For the Northeast, there were 140 immigrants from India, 85 from China and 55 from the Philippines in the 2011. These numbers all bumped up in 2016 with 410 immigrants from India, 115 from China, and 200 from the Philippines. This demonstrates a 192 per cent, 35 per cent and 264 per cent increase, respectively. Similar to the Northeast, the numbers of immigrants from India arriving in the Northwest had increased from 15 to 95 between 2011 and 2016, a dramatic 533 per cent [13] increase!
However, the Northwest had a polar opposite situation for immigrants originating from the Philippines and China. The data in the 2016 Census shows that the Northwest had 155 Filipino and 60 Chinese immigrants; the data in the 2011 Census was 200 Filipino and 70 Chinese immigrants.
For Africa, there is no shared top country of origin for Northwest and Northeast over the past two censuses. The Democratic Republic of Congo was the top country of origin for the Northeast as the number of immigrants increased from 30 in 2011 to 45 in 2016. On the other hand, the Republic of South Africa was the top country of origin for the Northwest as the number of immigrants increased from 0 in 2011 to 20 in 2016.
 In summary, even though Northern Ontario experienced a loss of immigrants from the Americas and Europe, Northeastern Ontario displayed a significant increase in immigrants from Asia and Africa. With the implementation of the Rural and Northern Immigration Pilot, cities in Northern Ontario could consider targeted approaches to those countries and continents with favourable immigration to the North. Such an approach could help with declining workforce problems and enhance cultural diversity, to name a few benefits.
[i] Author’s calculations. Unless otherwise cited, author’s calculations are based on data from Statistics Canada’s census program for various years.
Irina Chen is a summer Data Analyst at NPI.
Thank you to our Experience North Sponsor ![]()
The content of Northern Policy Institute’s blog is for general information and use. The views expressed in this blog are those of the author and do not necessarily reflect the opinions of Northern Policy Institute, its Board of Directors or its supporters. The authors take full responsibility for the accuracy and completeness of their respective blog posts. Northern Policy Institute will not be liable for any errors or omissions in this information, nor will Northern Policy Institute be liable for any detriment caused from the display or use of this information. Any links to other websites do not imply endorsement, nor is Northern Policy Institute responsible for the content of the linked websites.
Northern Policy Institute welcomes your feedback and comments. Please keep comments to under 500 words. Any submission that uses profane, derogatory, hateful, or threatening language will not be posted. Please keep your comments on topic and relevant to the subject matter presented in the blog. If you are presenting a rebuttal or counter-argument, please provide your evidence and sources. Northern Policy Institute reserves the right to deny any comments or feedback submitted to www.northernpolicy.ca that do not adhere to these guidelines.