Homelessness in Ontario's North
October 1, 2018 - Homelessness can take many forms. For example, the Homeless Hub outlines four different typologies: unsheltered, emergency sheltered, provisionally accommodated, and at-risk. Each form of homelessness varies, from those living in public spaces with minimal security to those who have temporary housing, or those living in an emergency shelter to those who are on the verge of experiencing homelessness (couch-surfing, unsafe housing, etc.). Homeless Hub further emphasizes that an individual does not always remain in one form of homelessness and can experience it in multiple forms.

The Homeless Hub’s State of Homelessness 2016 outlines that homelessness is no longer a problem felt by primarily older, single men. As shown in Figure 1 below, it spans across several demographic groups such as Indigenous peoples, veterans, and women. The report also found that the average stay in a homeless shelter for youth and individuals was ten days, while families and seniors stayed twice as long.
Figure 1: Demographics of Homelessness (%) in Canada, 2016
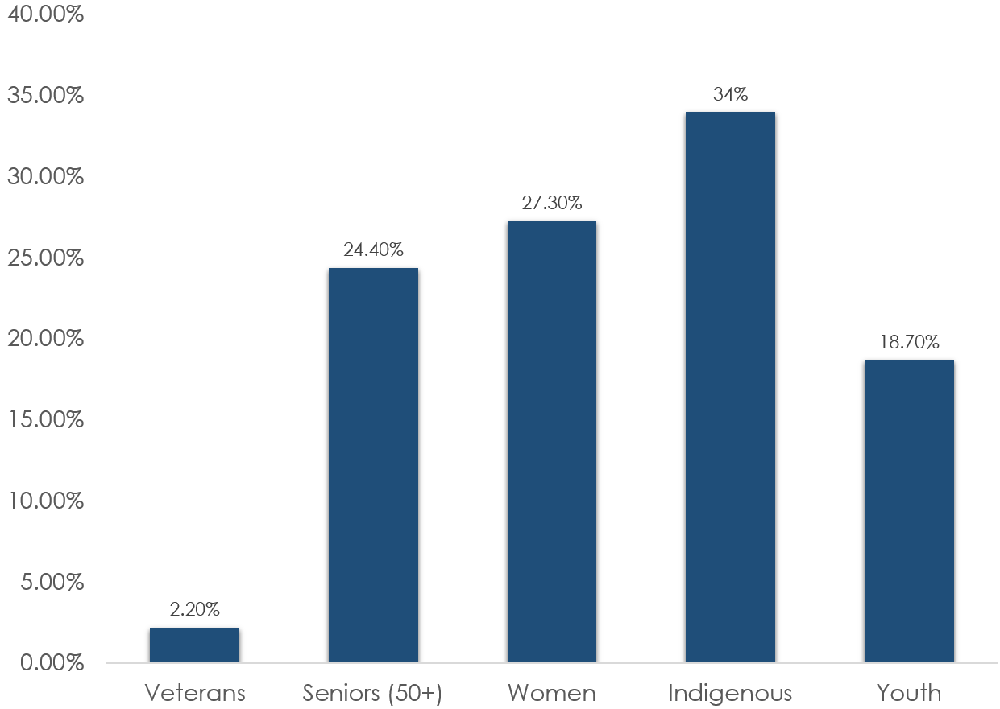
Source: The Homeless Hub’s "State of Homelessness 2016"
These statistics present alarming facts about the current representation of seniors, women, youth, Indigenous peoples, and veterans in the total population of homeless people. We can see that Indigenous people make up more than a third of those experiencing homelessness. When looking at Ontario, the situation is similar. Through the use of a point-in-time counts (PiT counts), communities are able to take a “snapshot” of the situation to understand who is homeless, why they are experiencing homelessness, the sources of income these individuals have, and other factors. Communities can use the information to create meaningful solutions to homelessness and allow for communities to track the effectiveness of such measures.
To illustrate, Thunder Bay, a city of 107,909 residents, interviewed 289 of their homeless population for a 2016 PiT count.[i] That same year, Brantford with 97,496 residents conducted their own PiT count with 95 families. Given the similarities in population size between Thunder Bay and Brantford, we can compare how the provincial numbers differ across the northern and southern parts of Ontario, allowing us to ask questions about why these differences occur. Using the case of Thunder Bay illustrates how the provincial data varies greatly when looking at Northern Ontario, specifically when looking at the overrepresentation of indigenous peoples.
Figure 2: Demographics of Homelessness (%) in Thunder Bay and Brantford, 2016
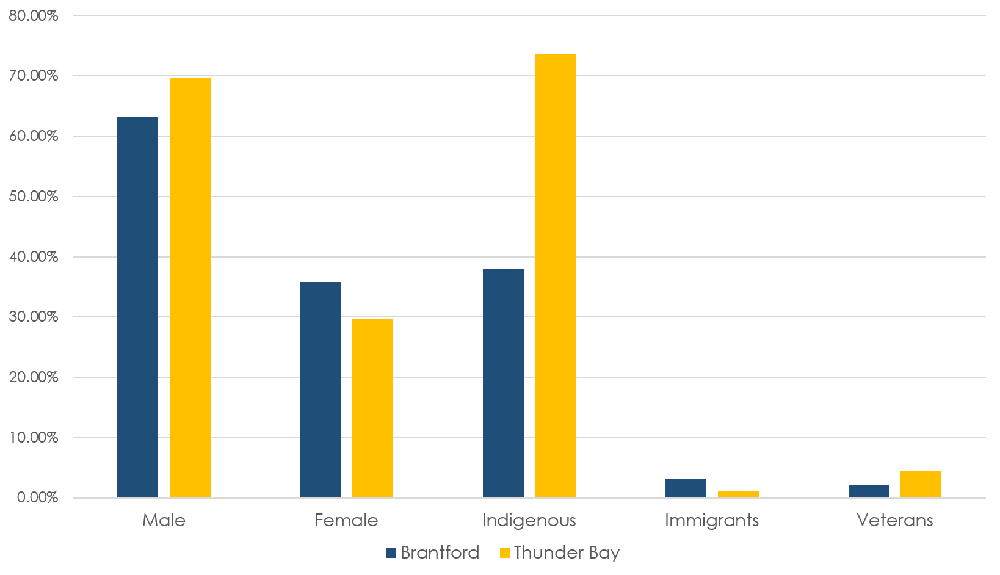
Source: Lakehead Social Planning Council, City of Brantford
Indigenous peoples represent a significantly larger proportion of the homeless population in Thunder Bay relative to Brantford, as noted in Figure 2. However, Brantford stated that their results confirmed an overrepresentation of Indigenous peoples who are homeless when looking at the total persons who make up their homeless population. The results of both surveys suggest the need to develop programming that meets the needs of the Indigenous population.
Several researchers have suggested that Indigenous peoples often relocate to Thunder Bay, whether for educational purposes or to escape an existing housing problem, but are unable to access or locate services necessary in assisting their situations. A similar situation exists in Brantford, with many Indigenous peoples relocating from reserves in the area into the city to find housing and services. Unfortunately, the individuals and families arrive in the community and often face barriers accessing basic needs, such as housing. This means that there are either not enough resources available or the resources that exist are not suited to the Indigenous populations.
Alongside overrepresentation of the Indigenous population, an aging one has also presented issues. Thunder Bay’s Under One Roof: Housing and Homelessness Plan addresses the challenges that have been arising. The plan notes that many seniors will be able to afford rent and housing, and their pressing concerns are around finding housing that meets their needs. However, it is important to note that more than 50 percent of the senior population in Thunder Bay are spending more than 30 percent of their income on rent. The Brantford-Brant Housing Stability Plan outlines a similar increase in their senior population and a similar need to find supportive housing resources. While comparable data for Thunder Bay was not available, Brantford reported that 8.4 percent of their seniors were homeless while for youth, the homelessness rate was 9.5 percent. Comparatively, the Thunder Bay Shelter House, the only shelter that accommodates youth, reported that youth make up 25 percent of their users.
The statistics present a daunting challenge, but they demonstrate the need for a multifaceted approach to effectively reduce homelessness. As Ontario has the highest proportion of Indigenous peoples across Canada, any approach to counter homelessness must address the needs of the Indigenous population. As noted earlier, transitions from reserves to larger urban communities present the greatest challenge, as such, communities must develop services that are inclusive, non-discriminatory, and are cognizant of the cultural needs of the Indigenous population. Services must address any language or cultural barriers that exist (e.g. provision of services in an indigenous language), addressing the different housing needs of Indigenous peoples (e.g. affordable housing units for large families), and increased education about the services that currently exist and how to access them. Additionally, as the population ages, housing needs must adapt to meet the needs of seniors. Generally, seniors today are better off than they have been historically and their needs for housing have also changed. This means developing supportive housing units and a management staff that are trained and equipped to deal with their needs.
Reducing homelessness starts with understanding that it’s not only what we see in the streets, and it’s not only one demographic. A successful strategy requires a community effort to address the individual needs of all demographics from culturally sensitive programs to increased housing adapted to meet demographic needs.
[i] Thunder Bay and North Bay are currently the only cities in Northern Ontario to have conducted a PiT count.
Winter Lipscombe is a former Policy Summer Placement with Northern Policy Institute.
The content of Northern Policy Institute’s blog is for general information and use. The views expressed in this blog are those of the author and do not necessarily reflect the opinions of Northern Policy Institute, its Board of Directors or its supporters. The authors take full responsibility for the accuracy and completeness of their respective blog posts. Northern Policy Institute will not be liable for any errors or omissions in this information, nor will Northern Policy Institute be liable for any detriment caused from the display or use of this information. Any links to other websites do not imply endorsement, nor is Northern Policy Institute responsible for the content of the linked websites.
Northern Policy Institute welcomes your feedback and comments. Please keep comments to under 500 words. Any submission that uses profane, derogatory, hateful, or threatening language will not be posted. Please keep your comments on topic and relevant to the subject matter presented in the blog. If you are presenting a rebuttal or counter-argument, please provide your evidence and sources. Northern Policy Institute reserves the right to deny any comments or feedback submitted to www.northernpolicy.ca that do not adhere to these guidelines.