Cooking with the Right Ingredients: The Challenges of Collecting Data in Northern Ontario
June 27, 2019 - Making policy decisions with low-quality, inaccurate or incomplete data is like making a meal with bad, wrong and missing ingredients. If it turns out well, you probably got lucky. Chances are, though, that stopped clock will be wrong for a long time before it happens to get it right again.
Unfortunately, data for Ontario’s northern regions can sometimes be low-quality, inaccurate or incomplete, so getting the right ingredients can take some extra work. Take the population of Kenora District over the past 15 years, for example. Even this incredibly straightforward, simple and clear dataset is hiding something behind its back.
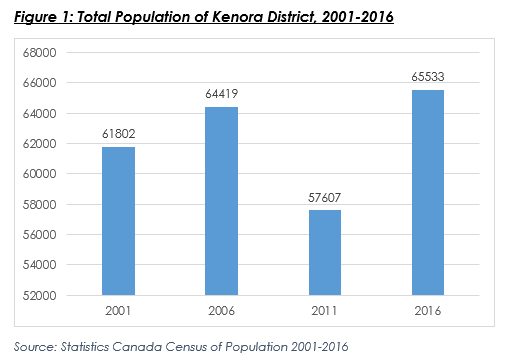
Why did the population drop 10 per cent from 2006 to 2011? Better yet, how did it rebound five years later? There were 7,926 more people in the 2016 census than in 2011, a 13.8 per cent increase. That’s three times faster than Ontario’s 4.6 per cent growth rate and more than double the national one. As a result, Northwestern Ontario grew 3.4 per cent.
That’s great news for a region that had undergone prolonged population decline. The figure made it into the news, community profiles, and the Ontario Ministry of Finance highlighted Kenora as the fastest growing CD in the province. There’s just one tiny, little problem.
The data is lying!
OK, it’s not actually lying, but it’s not telling the whole truth either. A number of wildfires in 2011 prevented 13 First Nations communities in the district from being enumerated at census time. They were counted later that year in a voluntary special collection, but, because the survey was not part of the census, those totals are not included in the census data. The special collection numbers are readily available, you just need know that they exist and that you need to find them yourself. If you don’t, your research is missing a key ingredient. That’s an issue, since those communities had roughly 8,520 people. Take them into account and the picture looks a lot less rosy.
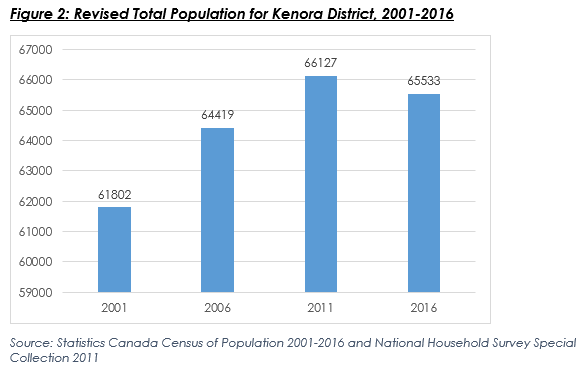
Suddenly Kenora is shrinking, for the first time this century. In fact, properly counting those people in 2011 is enough to push Northern Ontario as a whole into decline over five years. Despair not, though, for there is good news.
That data is not completely right either.
Pikangikum First Nation was not enumerated in 2016 for ‘other’ reasons, which could include health and safety issues, access restrictions, and so on. In 2011, the community’s population was 2,280 and the Independent First Nation Alliance estimates there were 2,300 people. If they grew at the same rate between 2011 and 2016 as they did from 2006 to 2011 (2,100 to 2,280), Pikangikum’s 2016 population would be over 2,450.[i] A couple of smaller First Nations communities also were not enumerated, meaning upwards of 3,000 people were counted in 2011 but not in 2016. That would be enough to push Kenora and the Northwest back into growth territory.
Then again, Attawapiskat was enumerated in 2016, but not in 2011, and is not included in the special collection. Adding them back in might just be enough to knock the numbers back to the bad side of the margin. There are more if we reach back to 2006 and 2001, but for mercy’s sake, we’ll leave it there.
The point is, even the simplest data is not always as clear as it seems. The census, Canada’s official population count, shows that Kenora District experienced a steep drop followed by a meteoric rise. This volatility has nothing to do with population change, it is just due to differences in who was and was not counted during each census period.
So you may be asking, why not adjust the 2011 totals? Statistics Canada has before, in Sioux Lookout, for example. The 1996 census shows a population of 3,469, but in the next census, the line that lists the 1996 population shows it as 5,165. The reason one agency came up with two different answers to the same question? Sioux Lookout’s boundaries changed when they annexed some neighbouring areas in 1998. Statistics Canada updated the total to give the most accurate picture.
According to Statistics Canada, their policy is to adjust totals only when boundaries change, not for evacuations. The census is a point in time snapshot of where people are on census day, and sometimes it misses people, especially in circumstance like this. That’s fair, evacuees certainly have more important things to do than fill out census forms.
Maybe a different dataset is in order then?
Statistics Canada’s less well known Annual Demographic Estimates: Subprovincial Areas is for just such occasions. This dataset tries to account for those that the census would have missed. Figure 3 below estimates that there are routinely 4,000 more people in the district than the census shows.
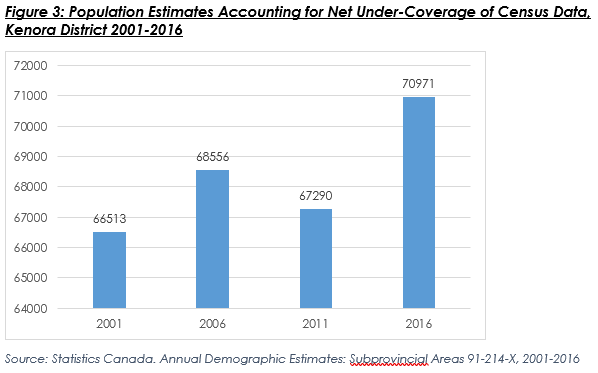
Overall, how do policy makers project demand for labour, healthcare or housing when their population could be growing 13.8, 5.5, or -0.9 per cent, depending on which data they use? One is three times faster than the province, one is slightly higher, and the last shows decline. Different ingredients lead to different results which trigger very different responses.
Data can be funny. When they testify, they swear to tell the truth and nothing but the truth, but sometimes they cross their fingers during the ‘whole truth’ part of the oath. That’s why it’s worth the extra effort to make sure you get the right ingredients. Otherwise, your only hope is to get lucky.
[1] To note, there is further data confusion considering Indigenous and Northern Affairs Canada lists Pikangikum’s registered on-reserve population at 2,877 as of May 2019. Media, meanwhile, put the total number of people at 3,800-4,000 when reporting on wildfires that forced the community to be evacuated in spring 2019.
Anthony Noga is a research analyst at NPI.
The content of Northern Policy Institute’s blog is for general information and use. The views expressed in this blog are those of the author and do not necessarily reflect the opinions of Northern Policy Institute, its Board of Directors or its supporters. The authors take full responsibility for the accuracy and completeness of their respective blog posts. Northern Policy Institute will not be liable for any errors or omissions in this information, nor will Northern Policy Institute be liable for any detriment caused from the display or use of this information. Any links to other websites do not imply endorsement, nor is Northern Policy Institute responsible for the content of the linked websites.
Northern Policy Institute welcomes your feedback and comments. Please keep comments to under 500 words. Any submission that uses profane, derogatory, hateful, or threatening language will not be posted. Please keep your comments on topic and relevant to the subject matter presented in the blog. If you are presenting a rebuttal or counter-argument, please provide your evidence and sources. Northern Policy Institute reserves the right to deny any comments or feedback submitted to www.northernpolicy.ca that do not adhere to these guidelines.