Fixing the Inadequacies: Does Northern Ontario Need its own Housing Strategy? Part One
July 16, 2018 - Northern Ontario needs more people. Forecasts show that the North will be short 150,000 people by 2041, even with natural growth rates. Such a coming demographic crisis is drawing the attention it deserves. Many are lobbying for an immigration pilot project for the North, but solving the population problem could cause a whole new headache.
 People need housing and northern housing is already strained. Sioux Lookout recently hosted the Northern Housing Summit to respond to this very issue, but quite simply, supply is not keeping up with demand in some rapidly growing communities. That vice will only get tighter if the region meets it population needs. Worse still, much of the existing housing stock is falling into disrepair.
Which means Northern Ontario faces some serious housing challenges.
So what? The federal government is rolling out its National Housing Strategy. Ontario just updated its Long Term Affordable Housing Strategy. The Ontario Non-Profit Housing Association released their own Affordable Housing Plan. Is that not enough?
Well none of them identify Northern Ontario’s distinct needs. For example, affordability is not as big a problem in the North as it is elsewhere. 24 per cent of Canadian homes are unaffordable, including 27.7 per cent in Ontario. The rate in Northern Ontario is 20.5 per cent.[1]
Data compiled by Rural Ontario Institute (ROI), on the other hand, does show what the North needs most. Their data is a custom tabulation of core housing need from the 2016 census. ROI does not look at affordability, only the physical condition of Ontario’s homes.
And the North is found wanting. Naturally this issue begs the question: Does Northern Ontario need its own housing strategy?
ROI places each census division (CD) into one of three categories: metro, partially non-metro, and non-metro. Next, they examine how many dwellings need major repairs, lack suitable bedrooms, and either need major repairs OR lack bedrooms.
Figure 1 shows how the CDs stack up in the either/or category. 10 CDs are above the provincial average; seven are in the North. The North has the seven worst non-metro, and the two worst partially non-metro CDs. Greater Sudbury breaks the trend by doing pretty well among the metro group.
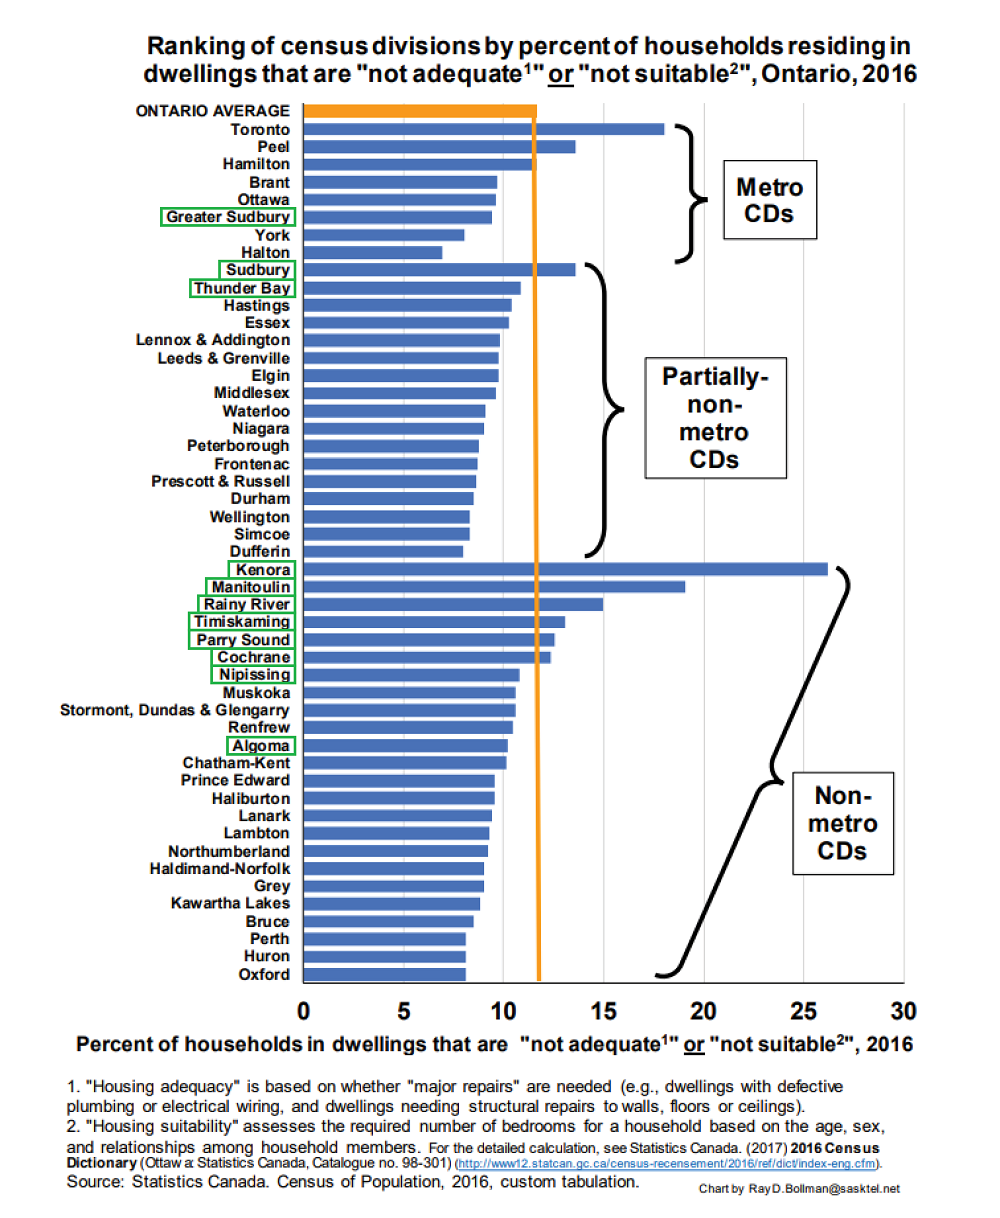
Figure 1: Northern Districts are highlighted. Rural Ontario Institute. Focus on Rural Ontario Vol. 5 No. 15, 2018.
Indeed, dwellings in the North are generally in worse physical condition than elsewhere. Breaking the total down is even more revealing.
Figure 2 looks only at unsuitable dwellings. An unsuitable dwelling lacks an appropriate number of bedrooms for the ages/sexes of its occupants. Aside from Kenora District, Northern Ontario performs pretty well compared to others. Greater Sudbury is the best metro CD, but more importantly, the Northern CDs are spread across their groups, rather than clustered at the top.
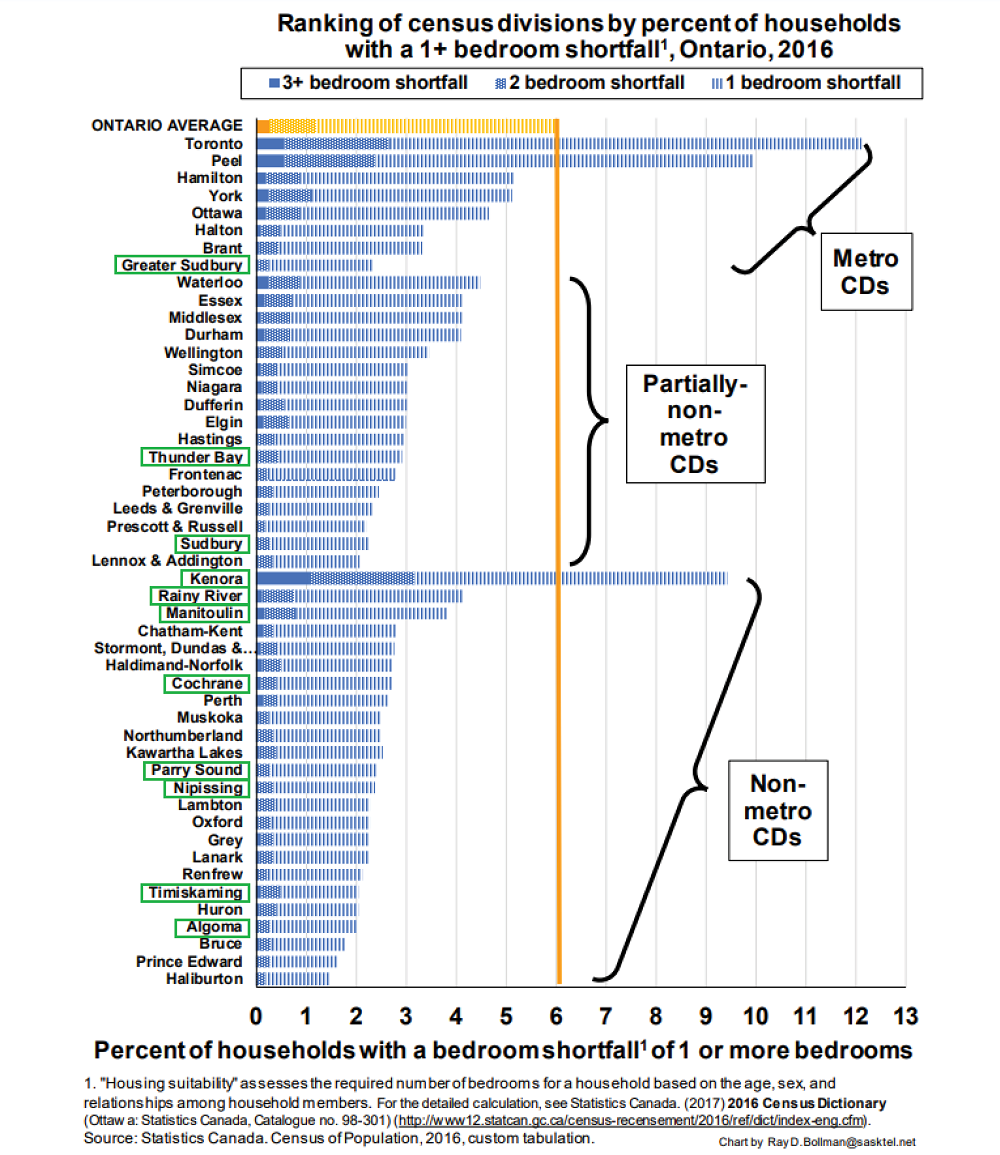
Figure 2: Northern Districts are highlighted. Rural Ontario Institute. Focus on Rural Ontario Vol. 5 No. 13, 2018
Recalling Figure 1, Northern Ontario has some of the highest rates of dwellings lacking bedrooms or needing major repairs. Yet, by and large, it does not lack bedrooms. So, the answer to the North’s poor showing is not behind door number one. And there are only two doors.
Figure 3 shows that all Northern CDs are above the provincial average for the percentage of homes needing major repairs. This includes “defective plumbing or electrical wiring and … structural repairs to walls, floors or ceilings”, which is a leading indicator of housing inadequacy. Aside from concerns over equity, housing inadequacy has been linked to physical and mental health issues.
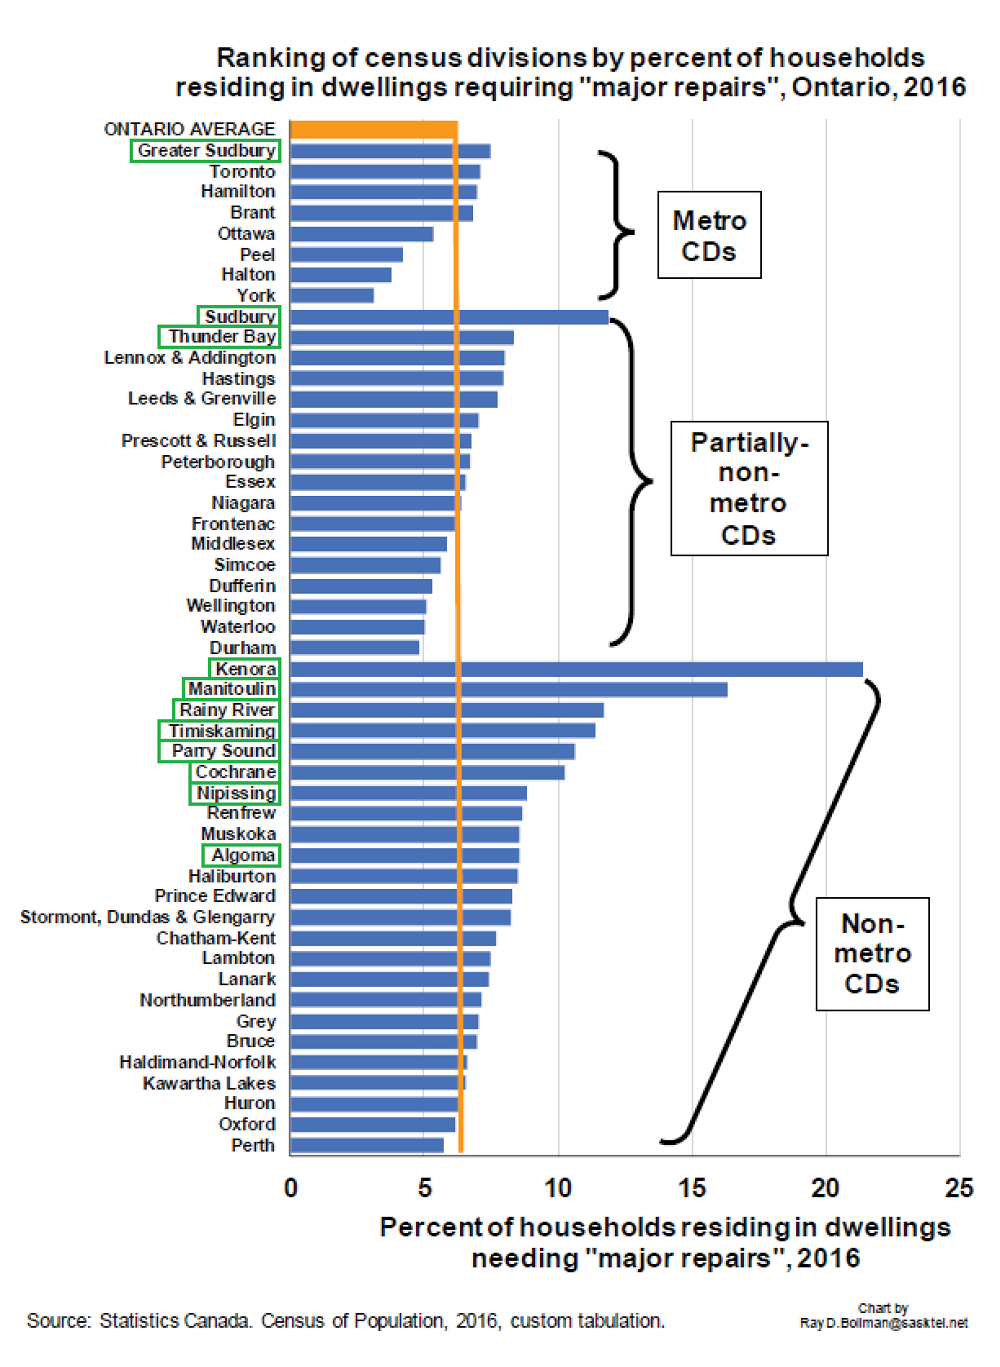 Figure 3: Northern Districts are highlighted in green. Rural Ontario Institute. Focus on Rural Ontario Vol. 5 No. 11, 2018.
Northern CDs are the worst in the province for inadequate housing, regardless of their group. This is most visible for non-metro CDs, where the North claims eight of the top ten spots. And the problem is universal. Figure 4 shows that every Northern district needs major repairs much more than they need bedrooms.
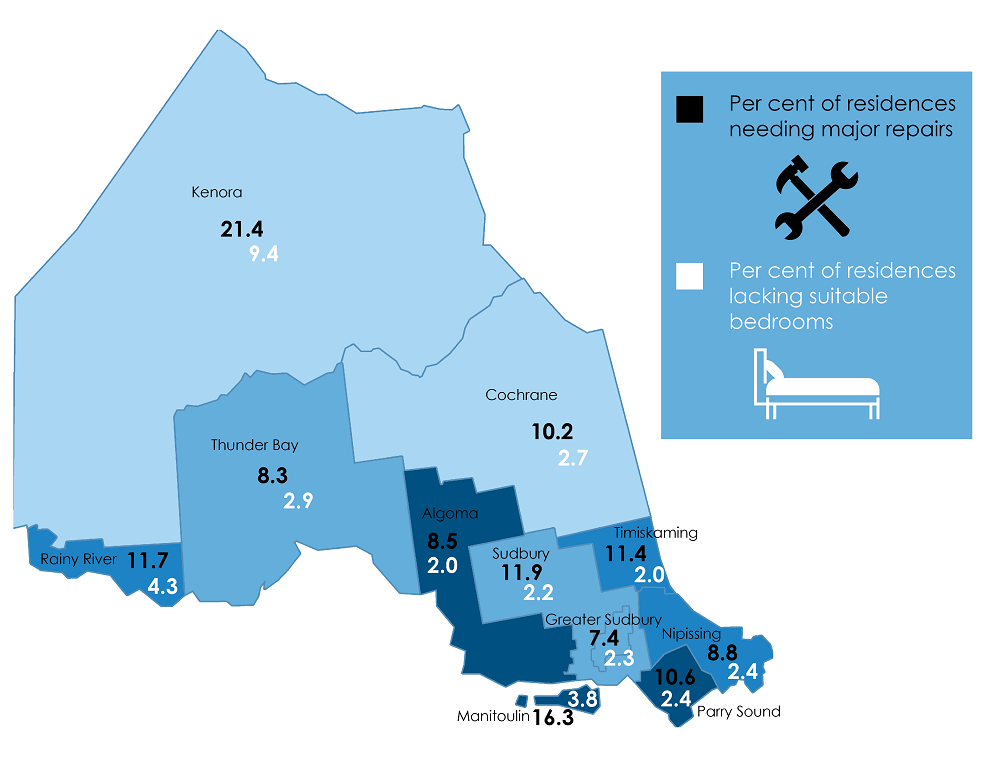
Figure 4: Data derived from ROI Focus on Rural Ontario Factsheets
There are 49 CDs in Ontario. The 11 Northern districts are among the 21 with the highest rates of inadequate housing. The 28 CDs with the lowest rates are all elsewhere. It might be natural to wonder if reserves are inflating the totals. After all, 44 per cent of people residing on reserves live in inadequate housing.
Then again, Wahnapitei First Nation, the lone reserve in Greater Sudbury, accounts for 0.1 percent of all households in the CD. Reserves account for only 24 per cent of all homes in Kenora CD.[2] Both lead their groups for inadequate housing. Clearly on-reserve housing is only one piece of the puzzle.
Overall, the data shows that Northern Ontario has distinct housing needs. It does better than the rest of the province for affordability and suitability, but much worse for adequacy. Maybe the North should have a strategy to address those distinct needs.
This blog is part one of a two-part series. Part two will explore what a housing strategy for Northern Ontario might entail.
Footnotes
[1] Author’s calculations from “Expanded table: Ranking of census subdivisions by percent of households in dwellings needing major repairs” http://www.ruralontarioinstitute.ca/knowledge-centre/focus-on-rural-ontario
[2] Author’s calculations based on Statistics Canada 2016 Census data. http://www12.statcan.gc.ca/census-recensement/2016/dp-pd/chn-biml/index-eng.cfm
Anthony Noga is a Research Analyst for Northern Policy Institute.
A special thank you to Ray D. Bollman, Research Affiliate, Rural Development Institute, Brandon University and Professional Associate, Leslie Harris Centre of Regional Policy and Development, Memorial University for compiling the data and for his patience and assistance with my questions. Thank you also to Rural Ontario Institute for sharing their data, and to Hayley Blake of NPI for generating the graphics.
The content of Northern Policy Institute’s blog is for general information and use. The views expressed in this blog are those of the author and do not necessarily reflect the opinions of Northern Policy Institute, its Board of Directors or its supporters. The authors take full responsibility for the accuracy and completeness of their respective blog posts. Northern Policy Institute will not be liable for any errors or omissions in this information, nor will Northern Policy Institute be liable for any detriment caused from the display or use of this information. Any links to other websites do not imply endorsement, nor is Northern Policy Institute responsible for the content of the linked websites.
Northern Policy Institute welcomes your feedback and comments. Please keep comments to under 500 words. Any submission that uses profane, derogatory, hateful, or threatening language will not be posted. Please keep your comments on topic and relevant to the subject matter presented in the blog. If you are presenting a rebuttal or counter-argument, please provide your evidence and sources. Northern Policy Institute reserves the right to deny any comments or feedback submitted to www.northernpolicy.ca that do not adhere to these guidelines.
Home build quality
Posted By Jackson Williams on 5/3/2024 10:54:44 AM
Affordability alone won't cut it in my opinion as well, as a homeowner, I wouldn't buy a home that is of poor build quality. Maybe some fixer-uppers would want to jump on that kind of deal but prospective buyers of new homes would certainly opt for a new construction house from a reputable builder/developer just like this site that would save them a lot of headache and additional costs.